Skip to content

Open-data epidemic surveillance · Ukraine

A 1–4 week forecast of incidence and load — from open data, without personal data

EpidemicWatch collects data from the Public Health Center, WHO, ECDC and oblasts, spots excesses over the seasonal norm and sends signals and a weekly brief to your team. You decide on the measures.

  • 5 infections
  • 24 oblasts
  • 1–4 week forecast
  • no personal data
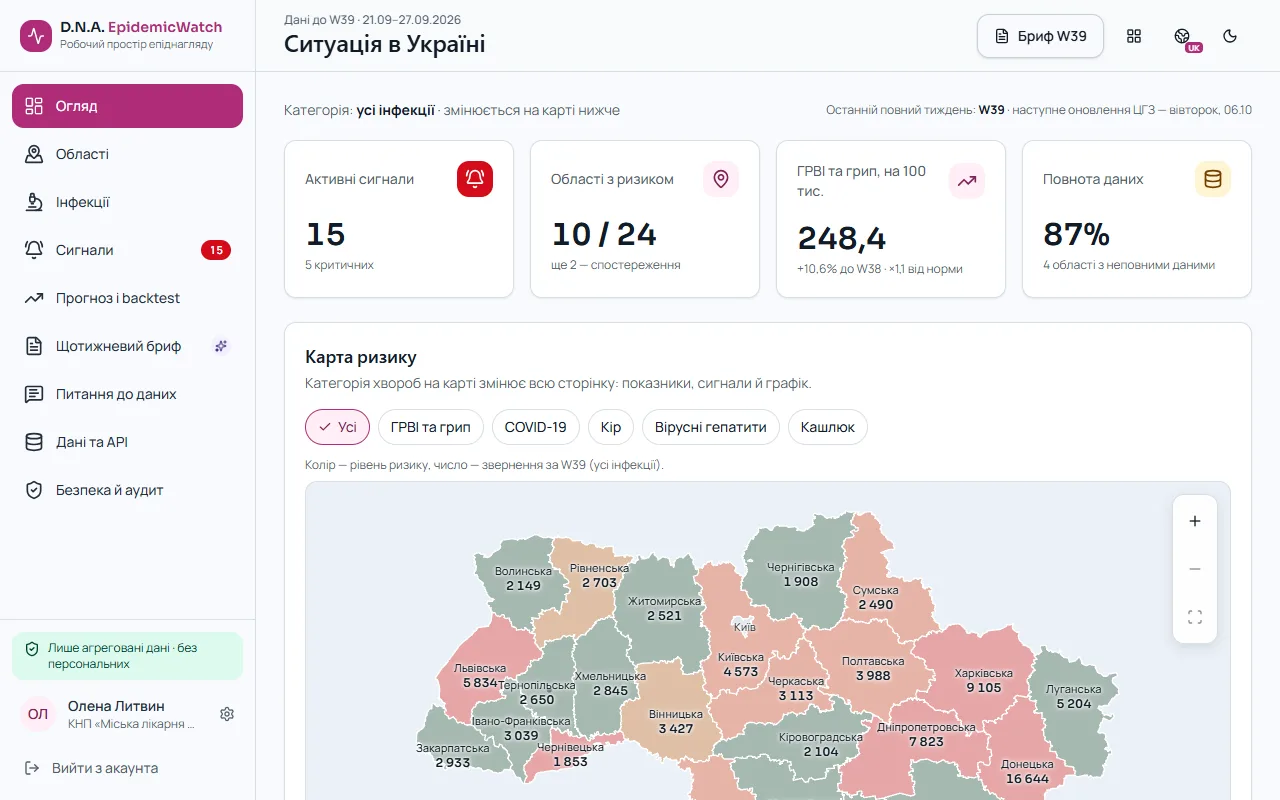
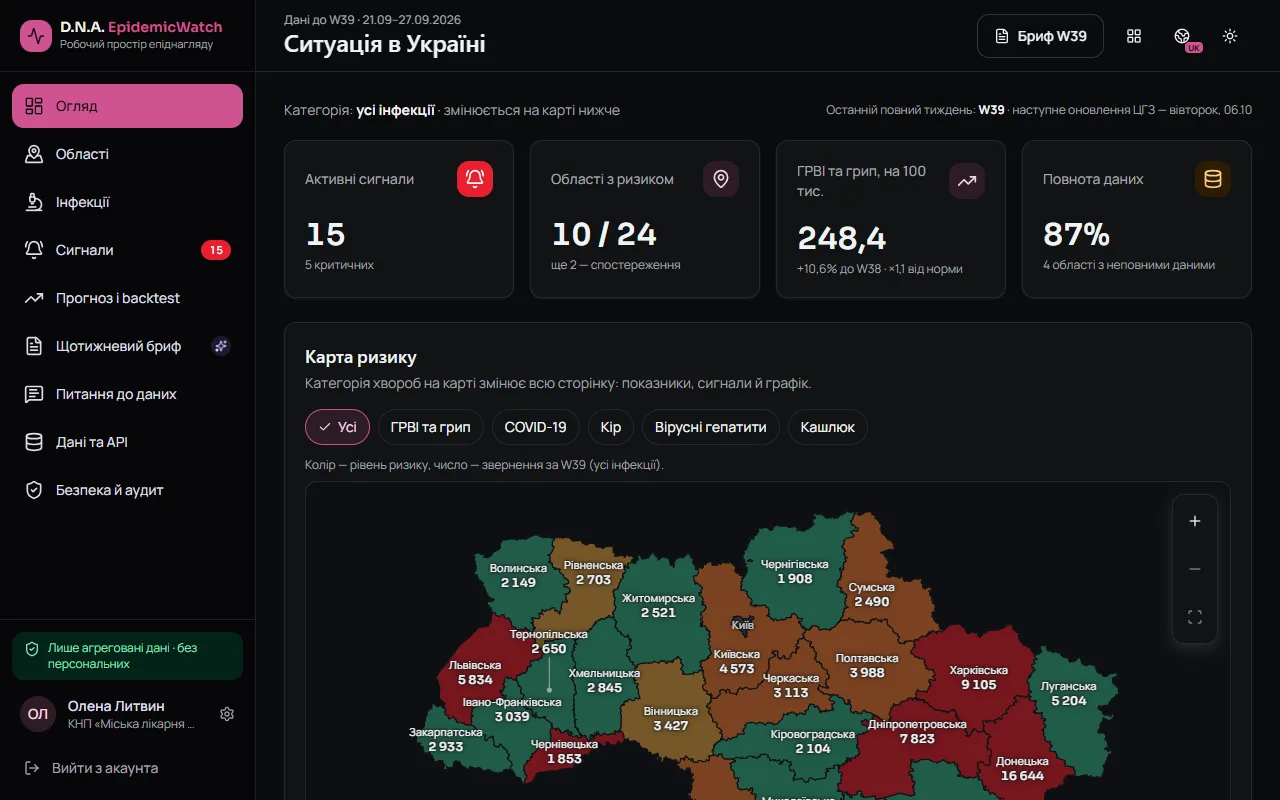
EpidemicWatch cabinet: oblast risk map and key indicators
Demo dataCabinet on demo data · W39 (21/09–27/09/2026)

Who it's for

One dataset — four different decisions

Pick who you are and see what EpidemicWatch shows you.

Expected load on the facility 1–4 weeks ahead

  • ARI visits and expected admissions with an interval
  • A signal when the oblast exceeds the seasonal norm
  • A weekly brief for the medical director

Kharkiv oblast · outlook for W41

Demo data
ARI visits in W41
now 8,838 per week

7,612

80%: 6,666–8,852

Change in load
W41 vs W39

-14%

Expected admissions
model assumption: 1.2% of visits

91

80%: 80–106

How it works

A week with EpidemicWatch

  1. 01

    Data every week

    PHC, WHO, ECDC and oblast centres — automatically; every source’s delay is visible.

  2. 02

    Excess detection

    Three methods compare the week with the seasonal norm: Farrington, EARS C2, CUSUM.

  3. 03

    A signal to your team

    Telegram or e-mail by your rules: oblasts, infections, level.

  4. 04

    Brief and forecast

    What changed, why it matters, what to watch — and a forecast with an interval 1–4 weeks ahead.

Features

What the system does — and what people do

AI drafts, people decide. EpidemicWatch does not diagnose or give medical advice.

  • Dashboard and mapSystem: 5 infections, 24 oblasts, hromadas (pilot); risk level and visit countsPeople: Picks the oblast and infection
  • Excess signalsSystem: Code, not a model: EARS / CUSUM, Farrington — by a level rulePeople: An epidemiologist confirms or dismisses the signal
  • 1–4 week forecastSystem: 80% interval and the model’s error on history (backtest)People: Plans beds, staff, purchases
  • Telegram / e-mail alertsSystem: Delivers signals by rules, keeps a delivery logPeople: Sets rules and recipients
  • Weekly AI briefSystem: AI drafts only from dashboard data; every number is checked automaticallyPeople: An epidemiologist approves before sending
  • Ask the dataSystem: Answers only from data, with a source; gives no medical advicePeople: Asks and decides
  • APISystem: Signals, series, forecast and brief for your systemsPeople: Integrates into own dashboards

Data honesty

Where the data come from and how far to trust the forecast

Sources and delays

  • Public Health Center of Ukraine

    official · Weekly, Tuesday · W39 · 21–27 Sep 2026

    delay 2 d
  • Oblast centres for disease control

    regional · Weekly · W39 · incomplete from 4 oblasts

    delay 2 d
  • WHO FluNet

    international · Weekly · W38 · 14–20 Sep 2026

    delay 10 d
  • ERVISS (ECDC / WHO Europe)

    international · Weekly · W38 · 14–20 Sep 2026

    delay 6 d
  • ECDC Surveillance Atlas

    international · Monthly · August 2026

    delay 15 d
  • Partner pharmacy chain (sales aggregates)

    partner, aggregates · Daily · 30 Sep 2026

    delay 1 d
  • Client clinics (aggregated visits)

    partner, aggregates · Weekly · W39 · 21–27 Sep 2026

    delay 2 d

Backtest: 3 ARI seasons

Demo data

Season-onset signal no later than the official announcement: 3 of 3.

  • 2023/24signal W46 · announced W493 wk earlier
  • 2024/25signal W48 · announced W513 wk earlier
  • 2025/26signal W47 · announced W503 wk earlier

ARI forecast error

4.1%
1 week
6.3%
2 weeks
84%
inside 80%

MAPE on demo history. Real figures are published after the backtest on PHC data (phase 2).

Brief sample

What changed this week — in a two-minute read

Epidemic situation, W39 2026Demo data

What changed

In W39 (21/09–27/09/2026) ARI & influenza incidence in Ukraine was 248.4 per 100k (+10.6% vs W38). There are 15 active signals in 12 oblasts. The largest deviations from the seasonal norm are measles in Lviv oblast (×8.1) and measles in Chernivtsi oblast (×6.5).

SourcesPublic Health Center of Ukraine 2026-W39 · UkrainePublic Health Center of Ukraine 2026-W39 · LvivPublic Health Center of Ukraine 2026-W39 · Chernivtsi

AI drafts only from dashboard data; every number is checked automatically and an epidemiologist approves the mailing. Updated weekly.

Security & compliance

Built on D.N.A. Health Core

  • No personal data

    Aggregates by oblast and hromada only; cells under 10 cases are suppressed.

  • Storage in UA / EU

    A separate D.N.A. Health Core contour isolated from other products.

  • Encryption

    Organisation data and settings are encrypted with the organisation’s keys (DCP).

  • Immutable audit trail

    Every action is a hash-chained event; the log can be exported for review.

  • Human in the loop

    An epidemiologist confirms signals and the brief; AI makes no decisions.

  • Sign-in via D.N.A. ID

    Single sign-on for staff with a second factor; access is granted by the organisation admin.

Pilot

The pilot is running — sign up for the next wave

Pilot participants get the dashboard, signals and the weekly brief for their oblasts and help tune the thresholds. We publish impact figures only after the pilot, with measurements and your consent.

Join the pilot

Pricing

Simple plans for organisations

Draft pricing — final terms are agreed in the contract.

  • Hromada / hospital

    $99 / mo

    Dashboard, Telegram & e-mail signals, weekly brief

    Request a demo
  • Business

    $299 / mo

    Everything in Hromada + staff and demand outlooks, several oblasts

    Request a demo
  • API & custom signals

    By contract

    REST API, custom detection rules, integrations

    Discuss

Grant projects: for hromadas and NGOs we connect EpidemicWatch within grants — terms on request.

FAQ

Frequently asked questions

Does the system hold patients’ personal data?

No. EpidemicWatch works with aggregates by oblast and hromada only; small cells (under 10 cases) are suppressed.

Where do the data come from and how often are they updated?

PHC, WHO, ECDC, oblast disease-control centres and, by contract, partner aggregates. The main update is weekly; every source’s delay is shown in the product.

Is this medical advice?

No. The system shows the epidemic situation and forecast; it does not diagnose or prescribe. Specialists decide on measures.

How accurate is the forecast?

Every forecast comes with an 80% interval and the model’s error on history (backtest), shown next to it.

How does the AI brief work?

AI drafts only from dashboard data and every number is checked automatically. Your organisation’s epidemiologist approves the brief before it is sent.

How do we connect and who gets access?

Leave a request — we run a demo and connect your organisation. Staff sign in via D.N.A. ID; access is granted by the organisation admin.

Is there an API?

Yes: signals, time series, forecast and brief. The API and custom signal rules are by contract.

Get started

Get the brief for free or request a demo

Free weekly brief

What changed in your oblast this week — after every data update.

Demo and pilot for your organisation

We’ll show the dashboard for your oblasts and connect you to the pilot.

Organisation type